What happens to a container between the mould and the finished pack
On site there is no batch of images captured first and judged offline afterwards; inspection is embedded in the production beat that was already there. A container passes five stages between the mould and the finished pack.
- Thermoforming. Containers come off the thermoforming mould, and the vision system has to check the cavity surface before packing.
- Robot loading. The robot places each container at a fixed position on the belt, which is what ties a product position to the verdict that follows.
- Into the capture position. The belt carries the container through the camera's field of view, and images of the container surface go to the edge device.
- Verdict produced. The system marks the detected regions on the image and calls the matching container OK or NG, with the result shown on the run dashboard.
- Robot sorting. The verdict goes out to the line over Modbus, and the robot places good and rejected pieces separately.
| Layer | Made up of | Responsible for |
|---|---|---|
| Conveying | Twin belts, centre-seam support, encoder, guides and guarding | Holds attitude and spacing steady; leaves a channel for imaging above and below; provides position sync |
| Optical imaging | Multiple line-scan cameras, lenses, reflected / transmitted lighting, dark enclosure | Continuous scanning of both faces (and through the material); when viewing from the side, the tilted imaging rig keeps the whole field sharp |
| Vision software | The VisionAgent agent, recipes / workflows, HMI dashboard | Capture and stitching, defect recognition, region mapping, thresholds and changeover, result output |
| Motion | PLC, X / Z gantry, multi-head vacuum cups, individual valve banks | Consumes verdicts by tray number; vents selected cups to drop NG pieces; stacks OK pieces automatically |
| Safety and upkeep | Light curtain, emergency stop, pick-out reset, dust protection | Interlocks while an operator reaches in; cleaning cameras and lights in a paper-dust environment |
The vision system does not change the loading and sorting motions that were already there; what it adds is the judgement in between. The camera image is first tied to a specific container, and a conclusion is issued before sorting — the boxed region on screen, the result card on the dashboard and the robot's motion all point at the same piece.
One agent pulling many lines
One edge agent carries all inference and training
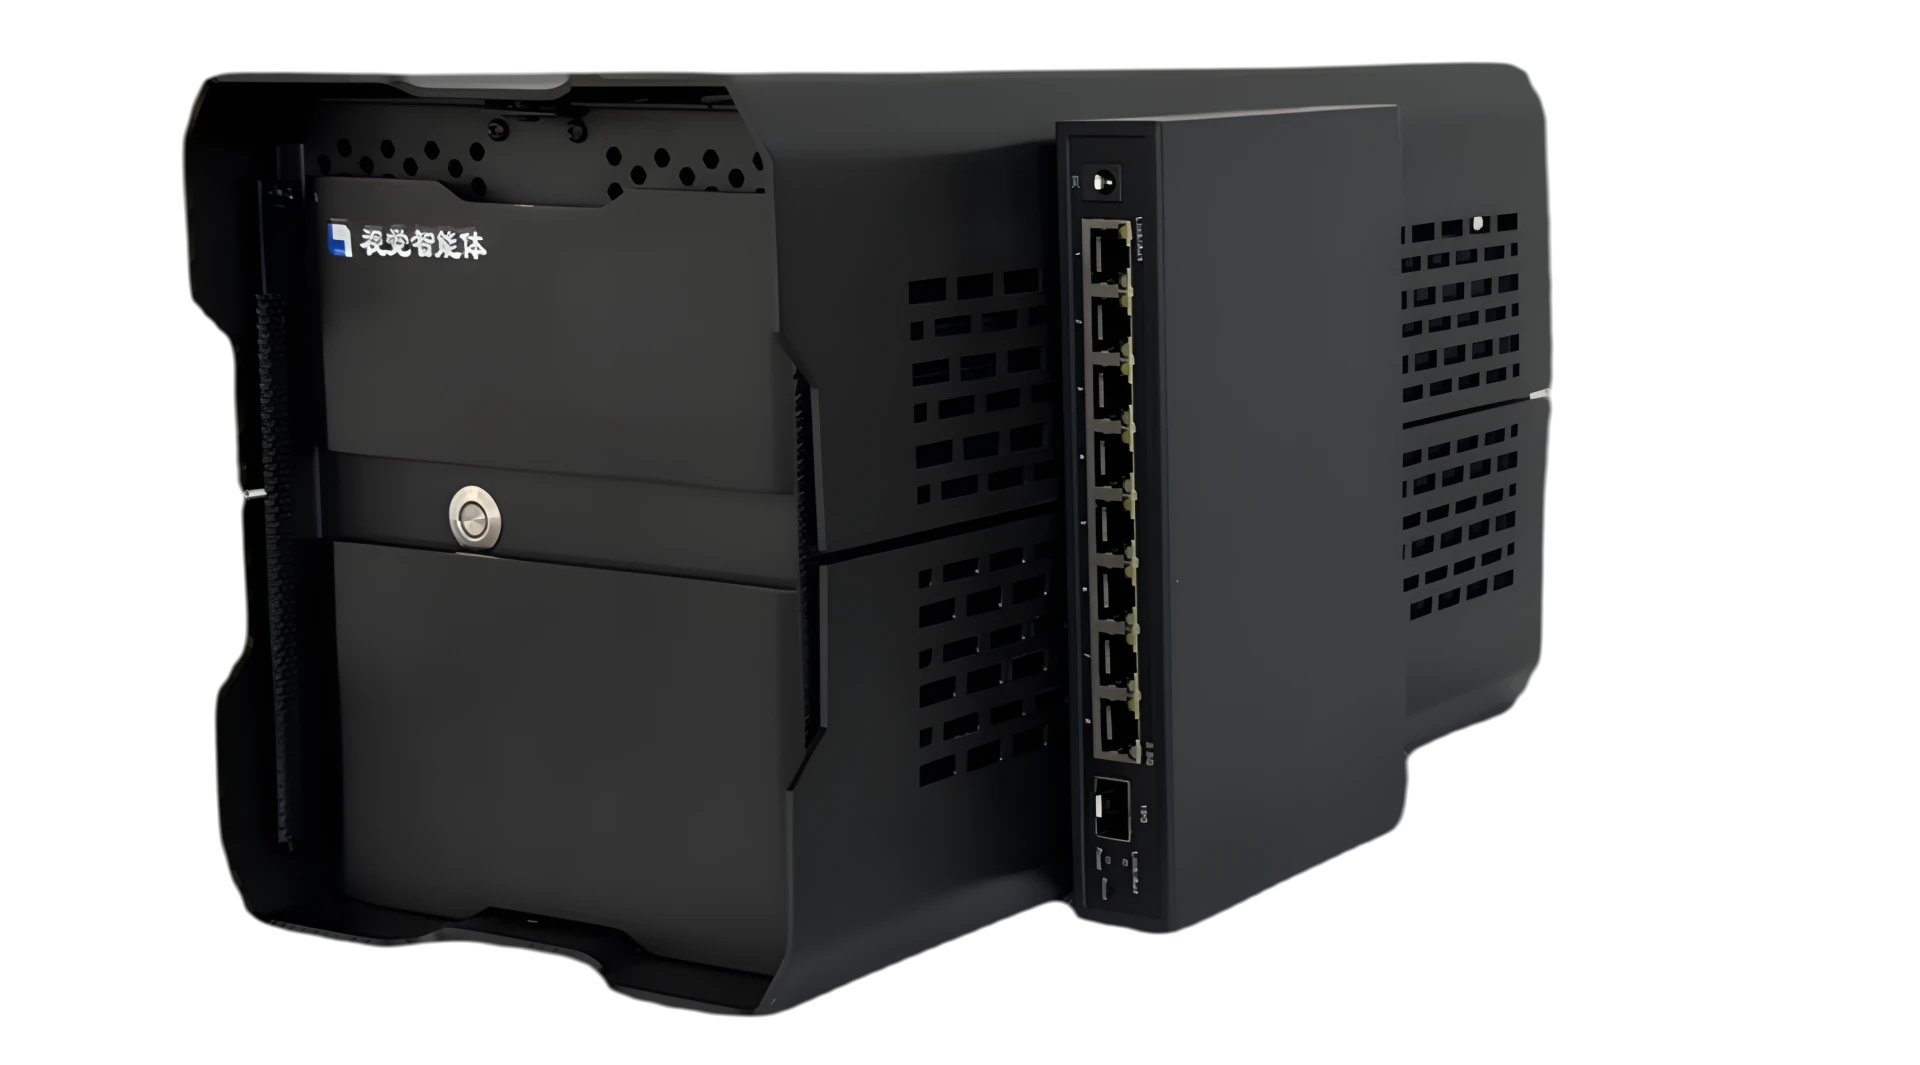
The vision agent is deployed on the line itself. Camera management, sample labelling, transfer training, tensor-flow configuration, run monitoring and result output all happen in the same software on this one machine, so the engineers doing the work are not switching between several tools.
The usual approach gives each line its own industrial PC and its own copy of the software, so as lines are added, hardware, licences and maintenance objects grow in proportion. The vision agent concentrates that layer: inference for about 80 cameras across 16 lines runs on this one machine, and adding a station means one more configuration on existing hardware rather than carting another machine onto the floor.
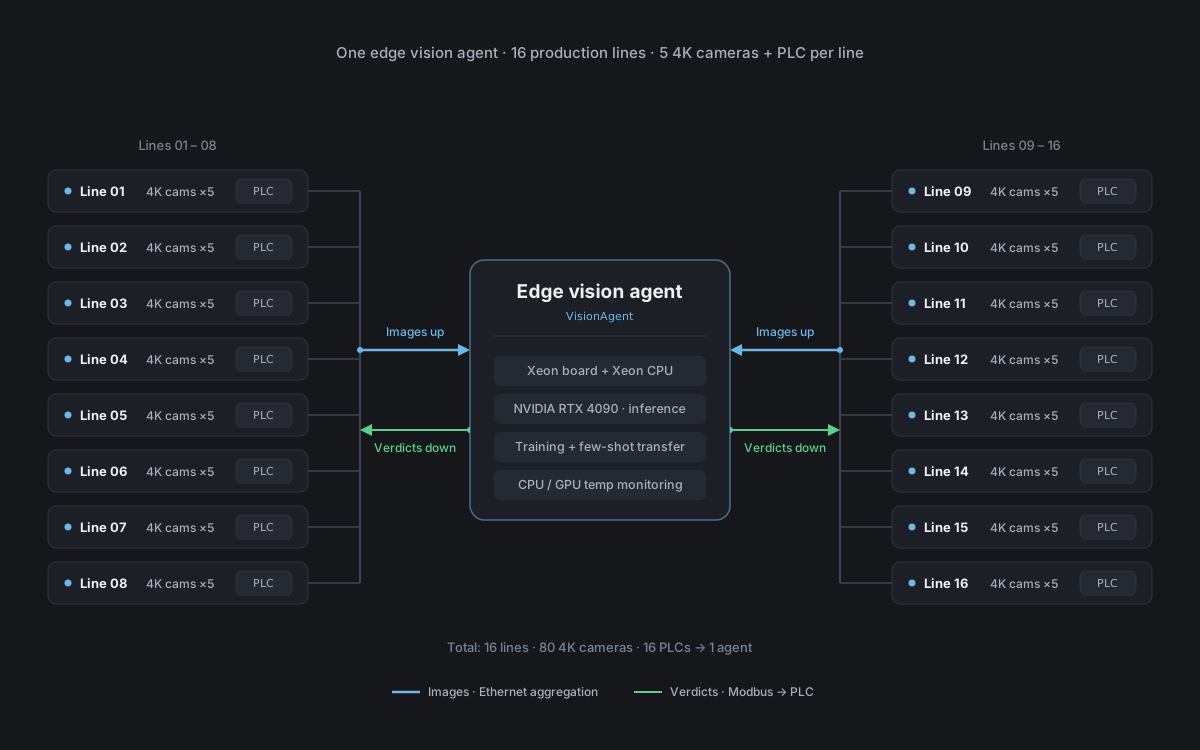
The other difference is that training and production are not kept apart. Images captured on site can be labelled further on this same machine, transferred, and the detection results reviewed there; once confirmed they go straight into the running pipeline for that station — no separate training server, and no exporting a model to deploy somewhere else.
Tensor flow, configured by drag and drop
Tensor flow puts processing steps that used to be scattered onto a single canvas, and building it is largely mouse work: drag an operator from the library on the left onto the canvas, pull a line from one node's output onto the next node's input and the chain is connected; once the layout is settled, each node is given its camera, its model and its output target.
That way of working is also what decides how far it scales. Eighty cameras on the canvas are eighty camera nodes side by side, dragged out one at a time onto the same chain, with no need for a separate project per station. Adding a station later is still one node and one line; as sixteen lines come in one after another, the canvas gets longer while the hardware stays that same single box. “One pulling eighty” is, on the software side, stacked up exactly one cell at a time.
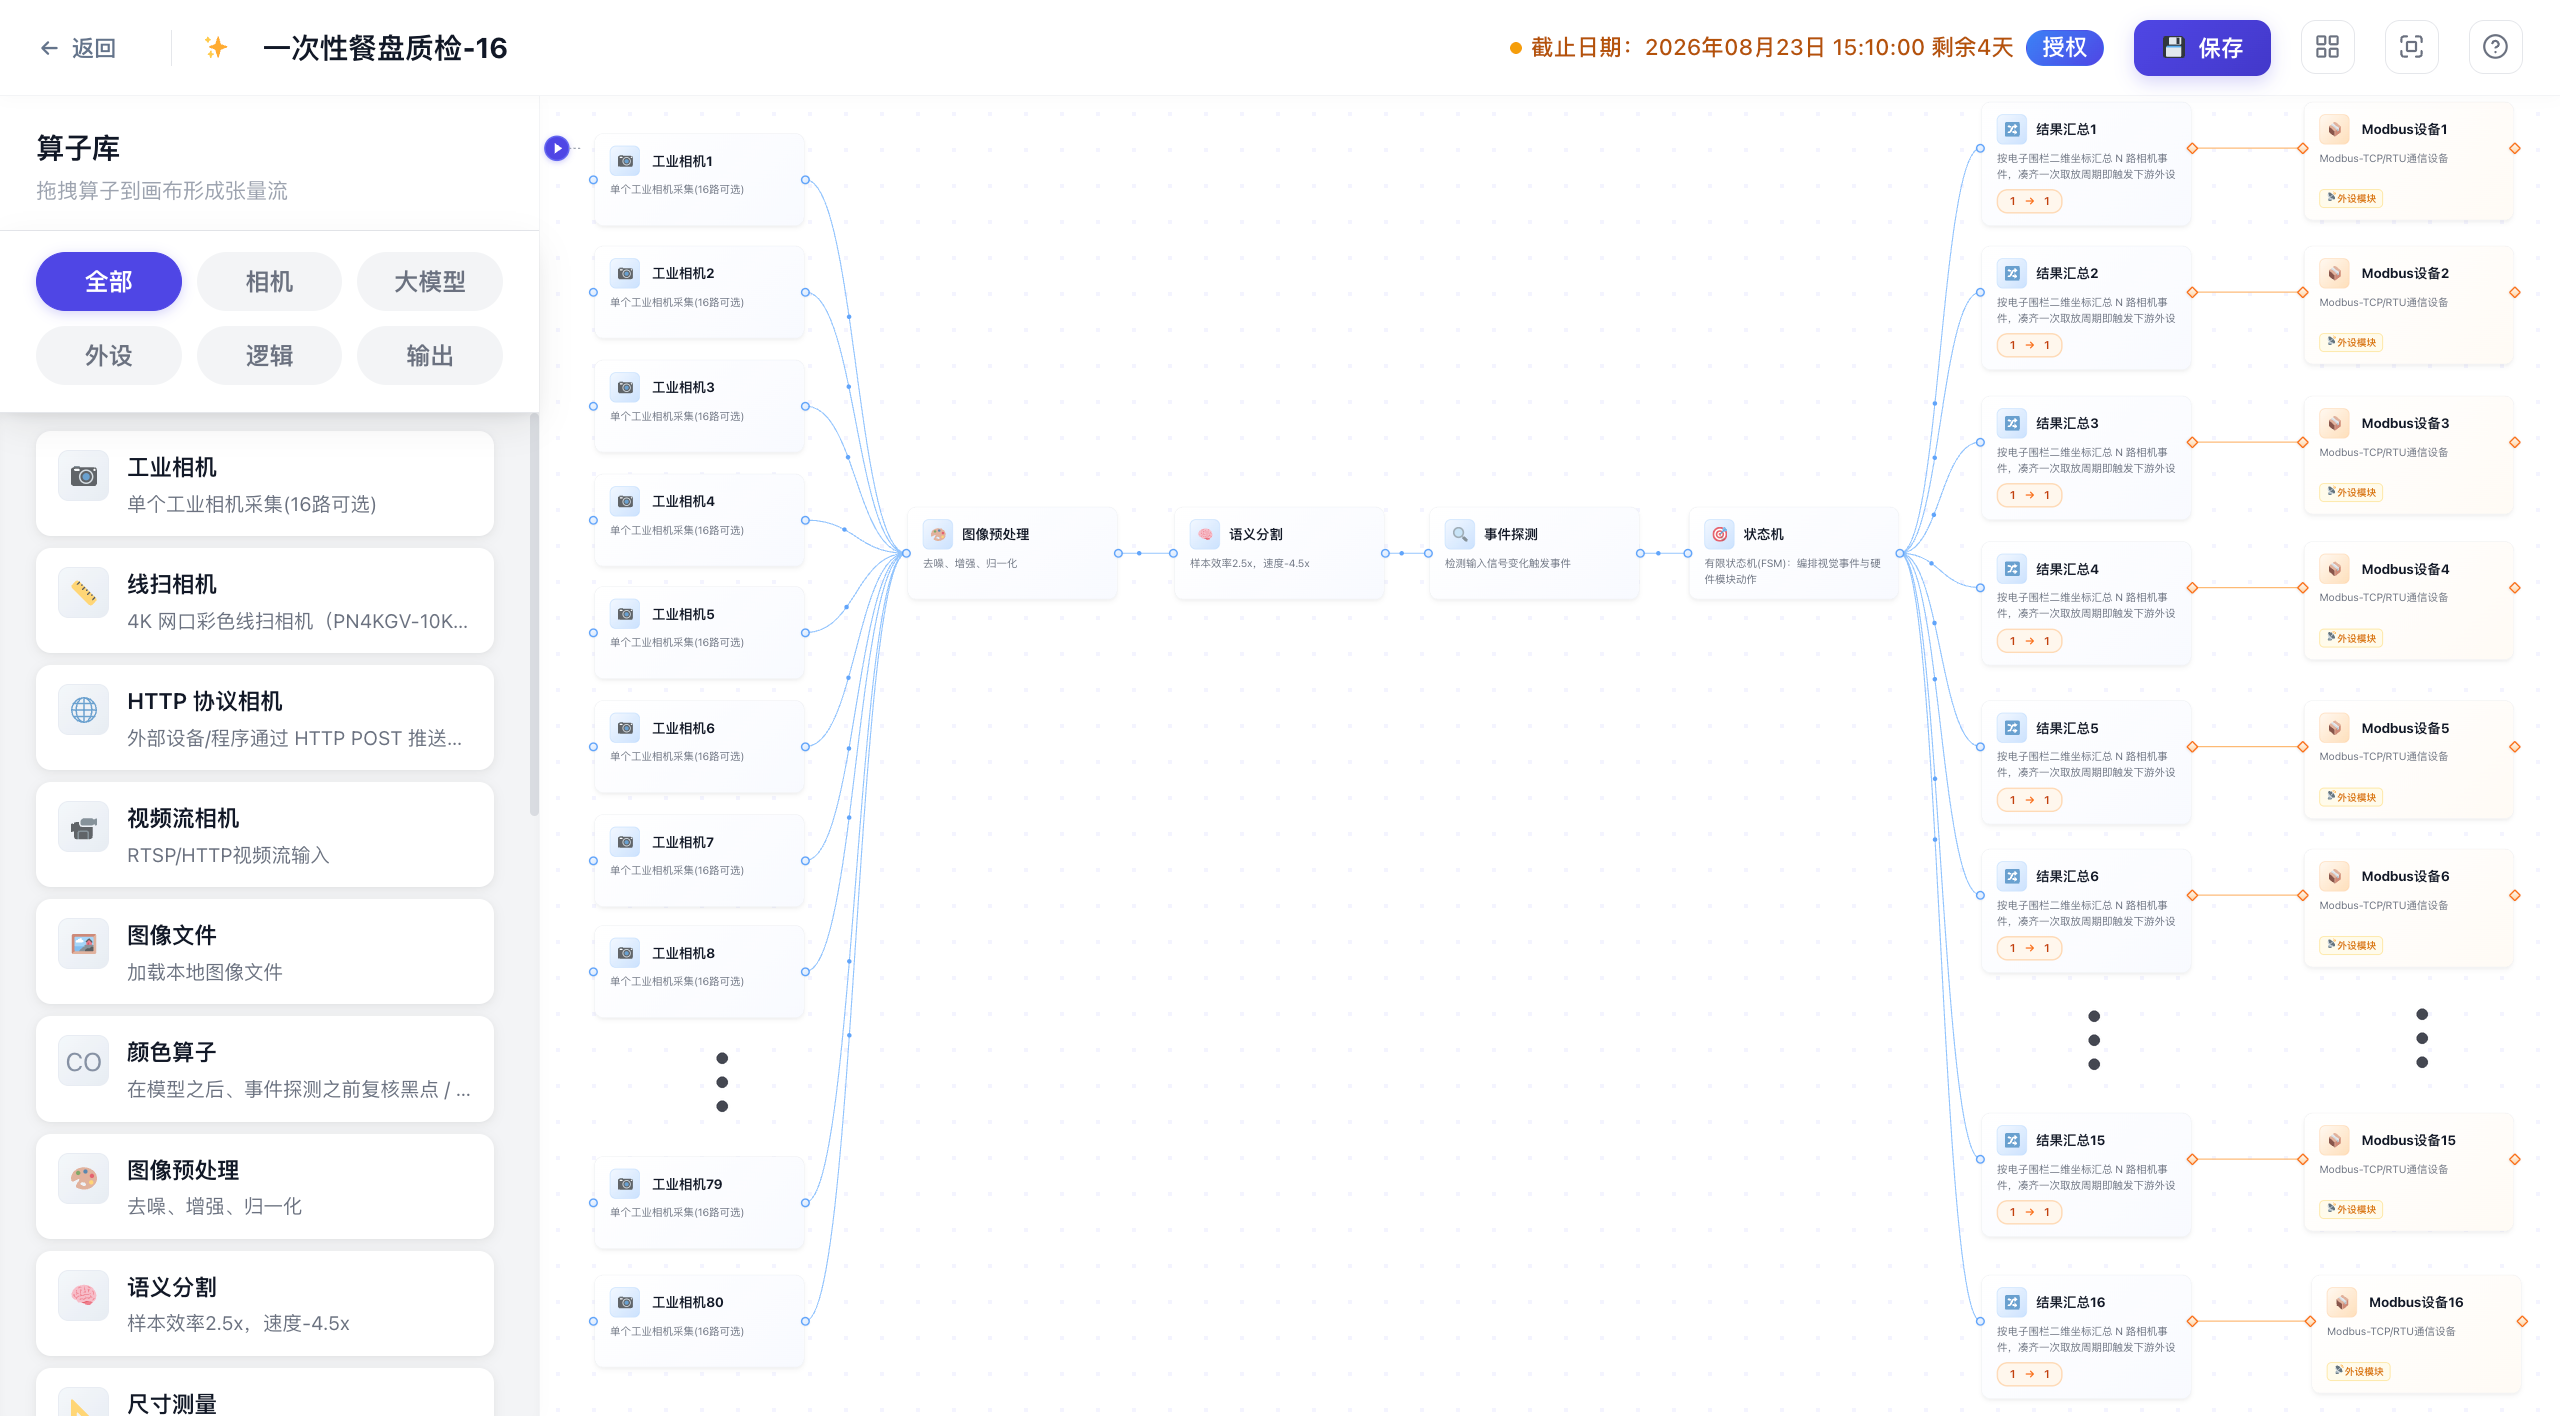
- Industrial camera: one node per station, producing an image frame each capture cycle and passing it to preprocessing.
- Image preprocessing: denoise, enhance, normalise and cut into 700×700 crops according to the station's configuration, then hand over to segmentation.
- Semantic segmentation: the model transferred for that station segments out the defect regions and outputs class, position and confidence.
- Event detection: state changes are picked out of the segmentation results and turned into events carrying station and product position, then sent on to aggregation and the state machine.
- Result aggregation: the several event streams for one product are merged into a single per-piece OK / NG verdict.
- State machine: tracks where products are on the conveyor so the verdict lands on the right piece at the right moment.
- Modbus device: writes the verdict to the line PLC, which is what the robot sorts on.
The picture differs from station to station but the configuration method does not; when something needs tracing, you follow the links out from the camera node and can see at a glance whether results reached aggregation and output.
Eighty cameras: why one box keeps up
Connecting them is a canvas question; keeping up with them is a throughput sum. The recognition model takes 700×700 crops, and this machine's inference throughput is counted at 200 crops per second; capture on site runs on a 20-second cycle, so the inference budget for one cycle is 200 × 20 = 4,000 crops. The other side of the budget is consumption: each camera produces one 4096×4096 frame per cycle (line-scan cameras converted to equivalent frames by scan length), which at 700 px cuts into ⌈4096 / 700⌉ = 6 slices each way, 6 × 6 = 36 crops in total; 6 × 700 = 4,200 px covers each edge, and the 104 px beyond the original frame is left as overlap at the seams, so nothing is downsampled and no pixels are missed. Five cameras on a line come to 180 crops.
Even if the images from all 16 lines arrive within the same cycle, 2,880 crops at 5 ms each processed serially finish in about 14.4 seconds, still inside the 20-second beat; against the ceiling of 22 lines, the site stops at 16 and keeps 28.00% in reserve for re-shoots, trial runs of new products and lines added later. “One pulling eighty” holds up because this budget was never overspent.
Keeping up is one thing; staying up is another
Concentration buys value for money and concentrates the risk along with it: 16 lines share this one machine, and if it stops, it is not one line that stops. Reliability is therefore not a bonus feature but the precondition for one-to-many — this vision agent was specified to server standards from the outset.
- Server-grade selection: a Xeon server board with a Xeon CPU, designed for 24/7 continuous load; inference runs on an NVIDIA RTX 4090, and the 200 crops per second in the throughput sum comes from that card.
- Thermal design: the air path is designed for continuous full load, so temperatures stay in a safe band under sustained high utilisation and no thermal throttling drags out the 20-second beat.
- Temperature monitoring: CPU and GPU temperatures are sampled continuously and alarm when they go out of range, so a problem is dealt with before it turns into downtime.
- Backup and restore: the tensor-flow configuration, the per-station recipes and the transferred models are backed up automatically every day, and a backup can be imported as a whole onto another box — no re-labelling and no retraining.
- Spare box on site: the plant keeps one identical vision agent in reserve. If the primary box fails, the spare is swapped in, the day's backup is imported and the camera and Modbus connections are re-checked; the work itself takes one to two hours, and the commitment to the customer is production restored within four hours.
Labelling, imaging and who does what
A vision foundation model: few samples, strong generalisation — the core technology
Dirt, foreign matter and impurities on a container surface have no consistent shape, size or position. Targets like these are not like a chipped edge or a crack with stable geometry that can be described — the same smear from another angle or under another light looks like something else entirely. Handled the way a traditional small model would be, this usually means gathering tens of thousands of images first, with a training cycle measured in months; and this plant changes product too often to wait that long.
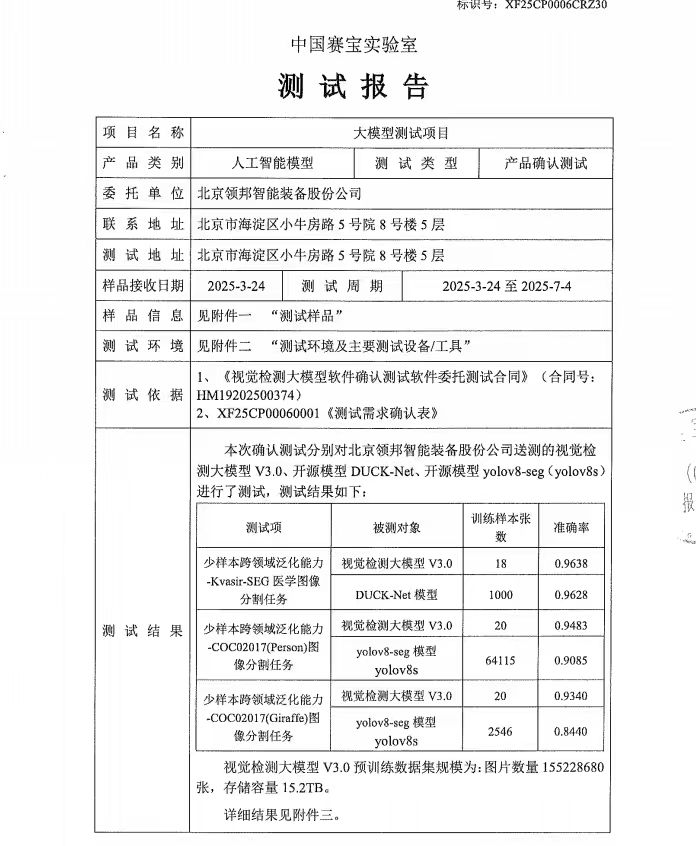
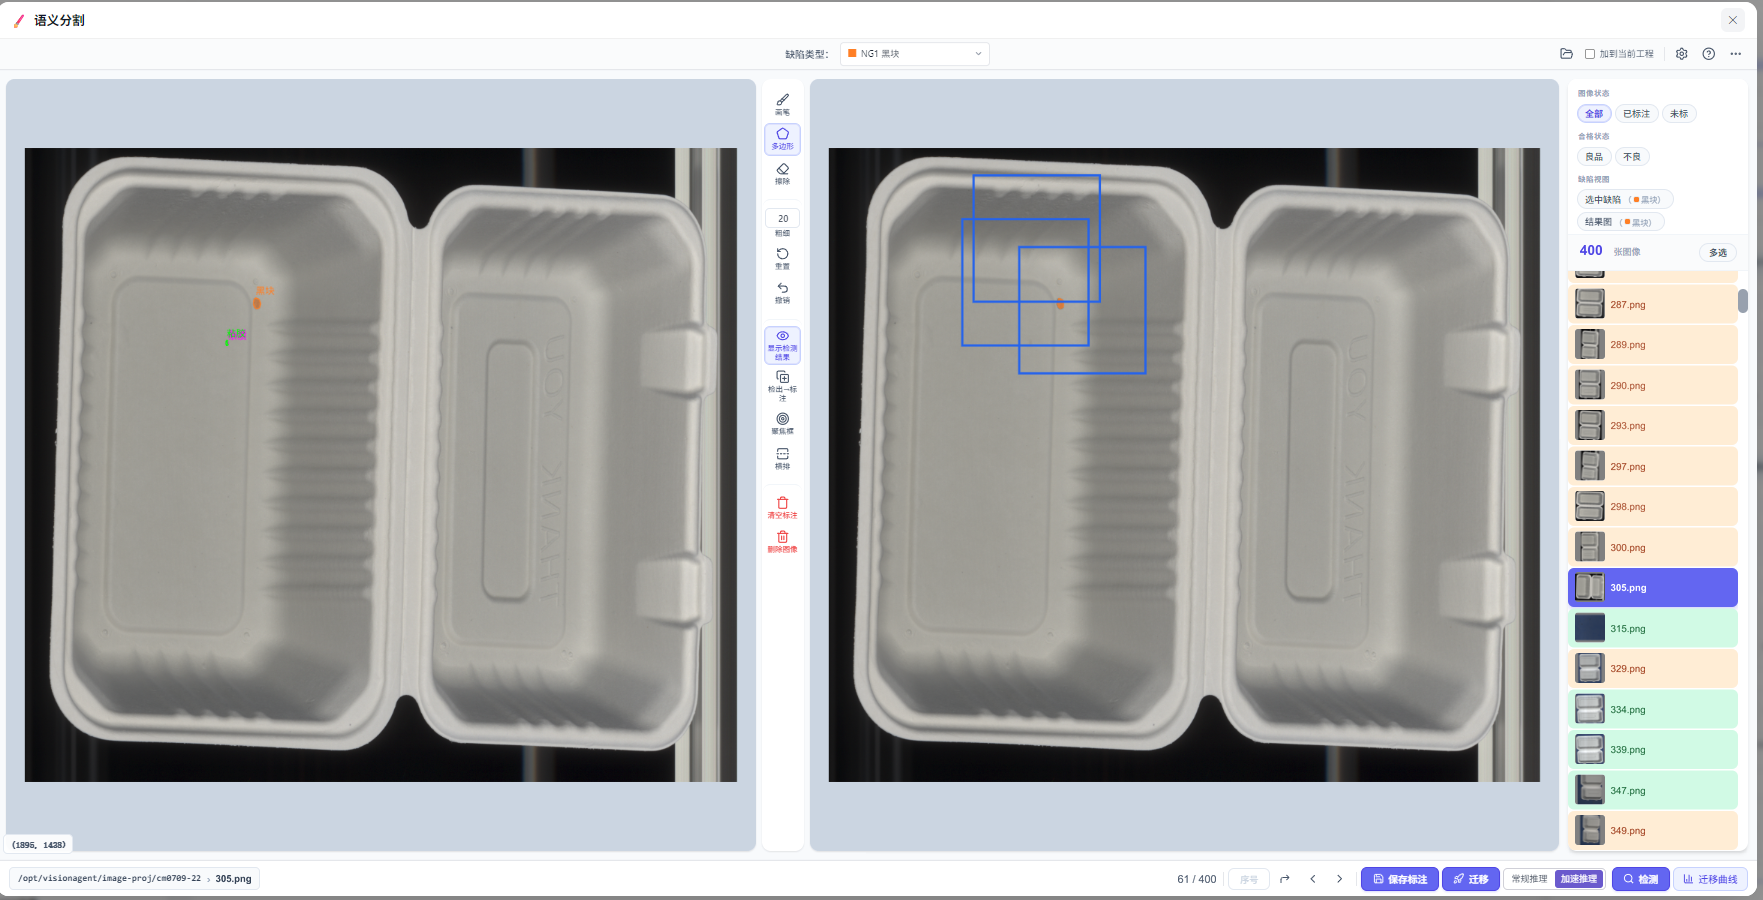
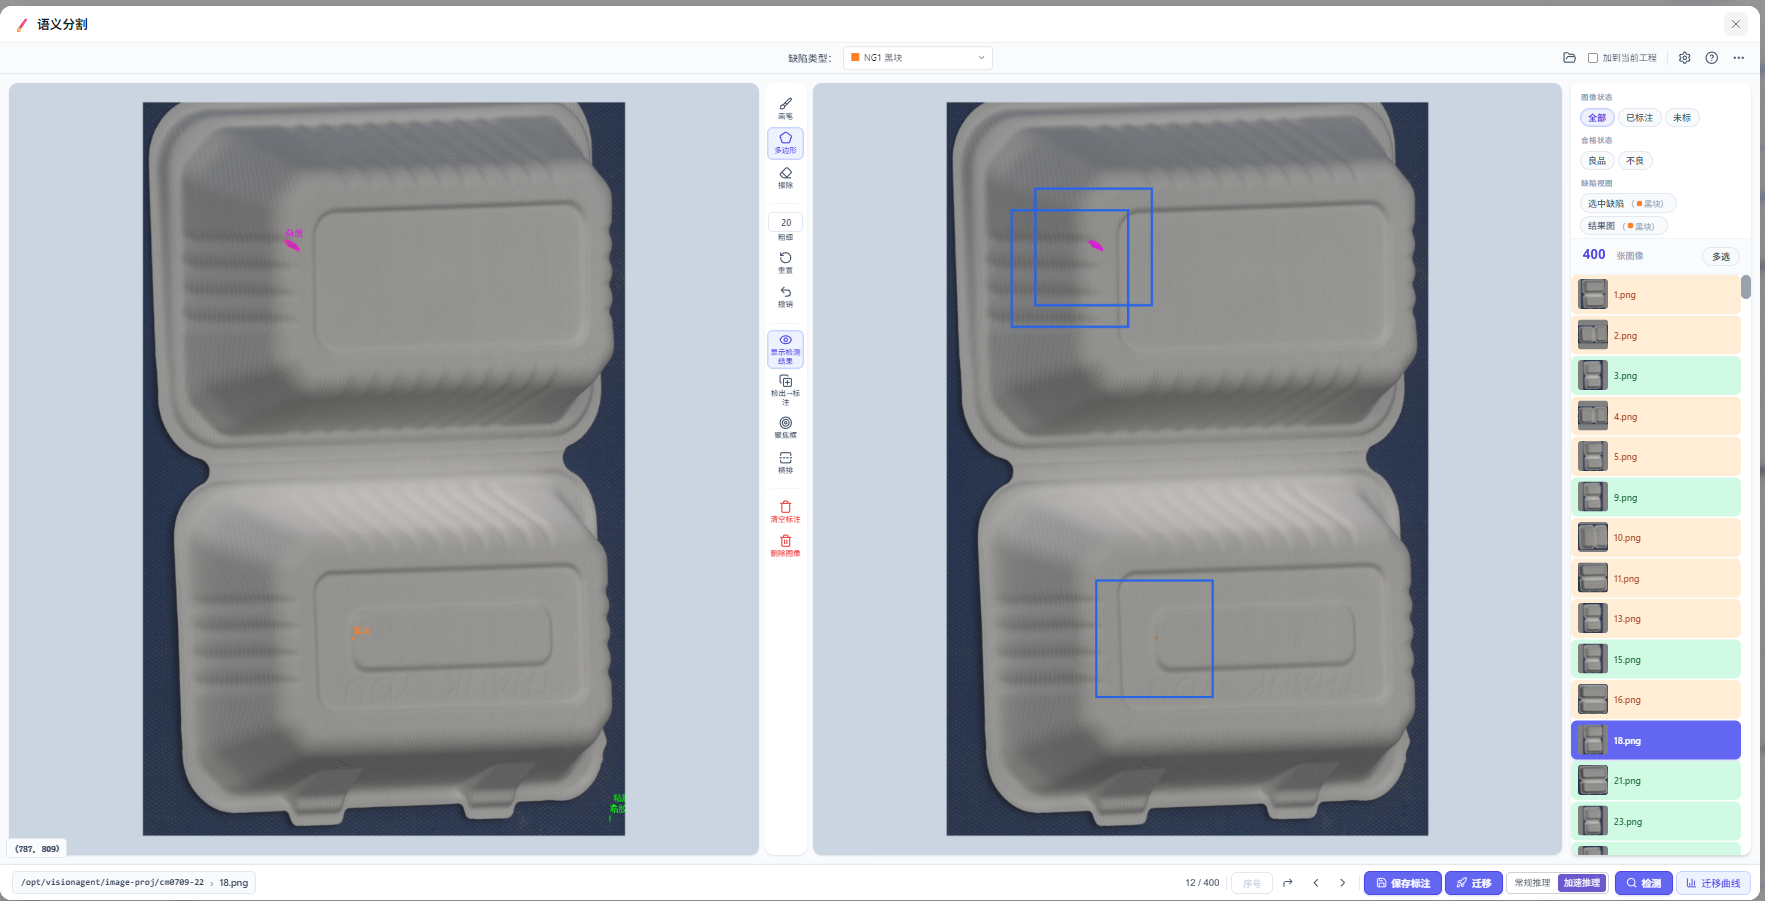
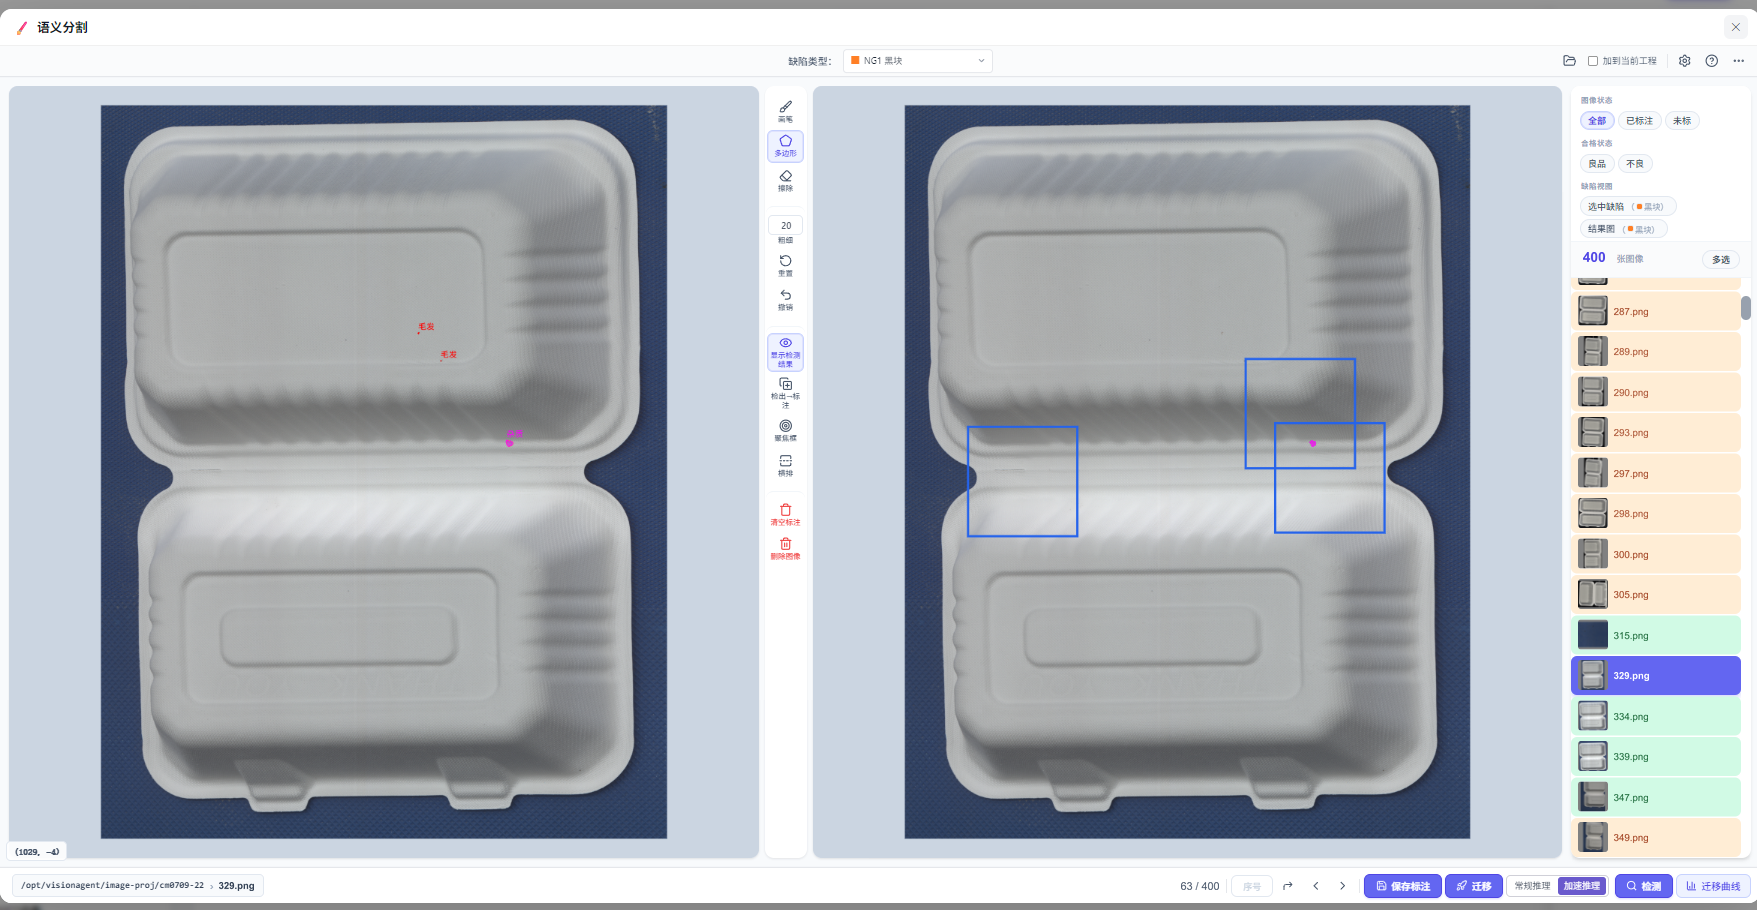
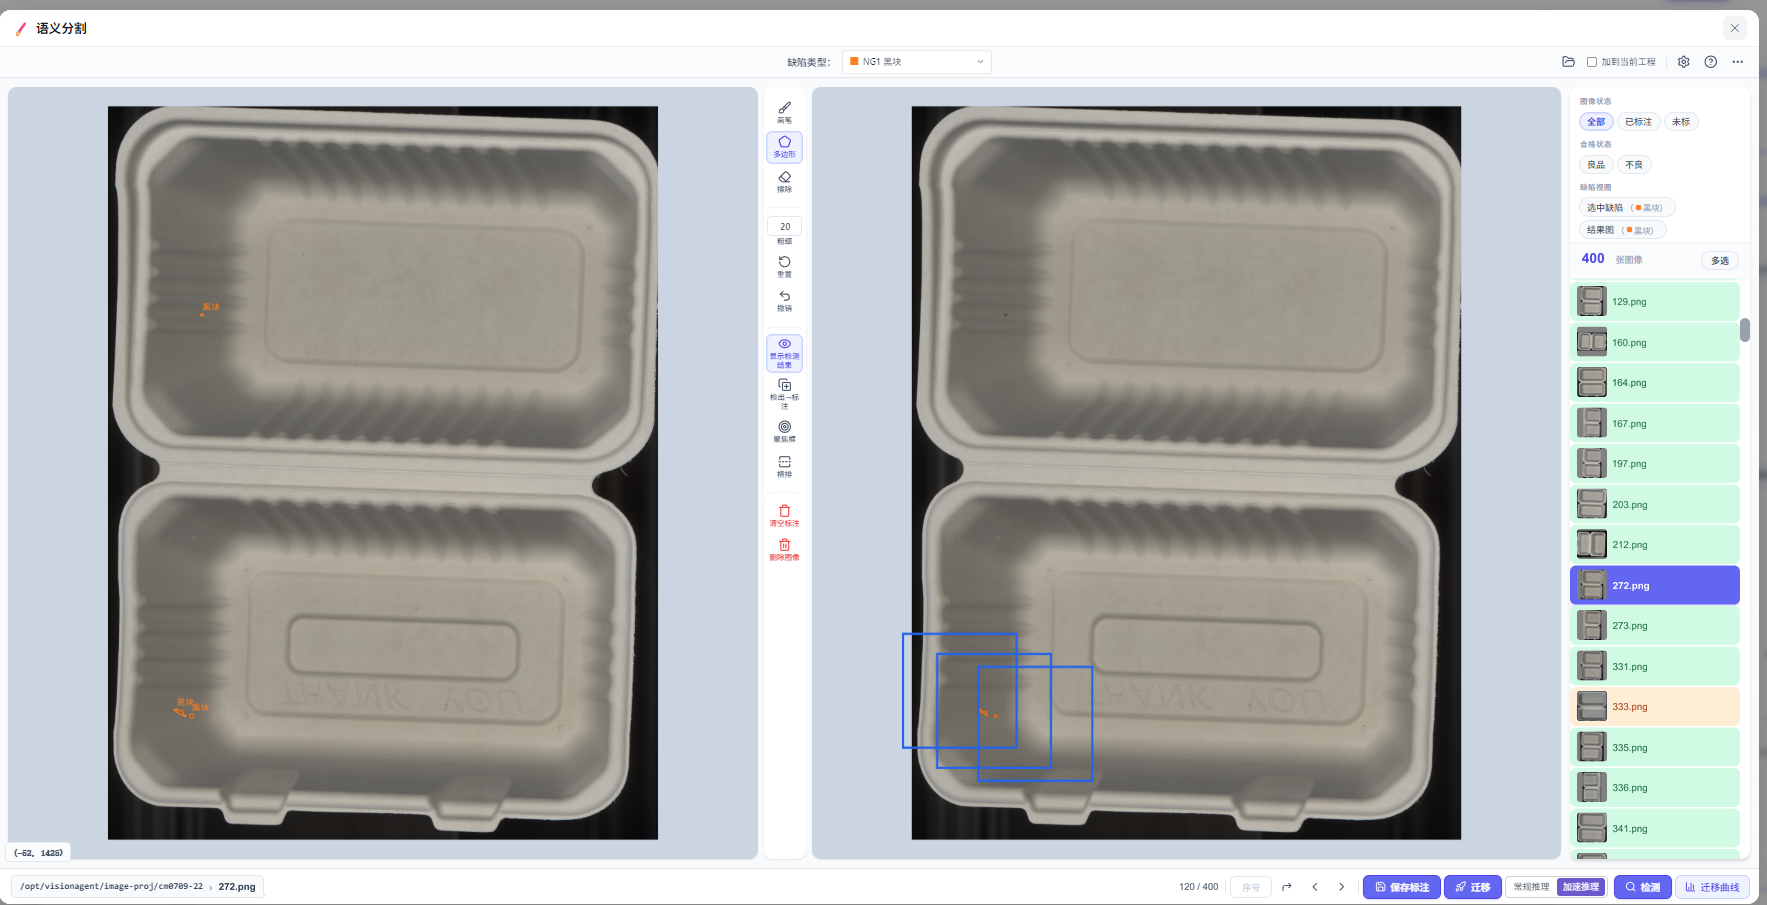
So recognition is built on few-shot transfer from a vision foundation model: the general recognition ability the model already has is moved onto the targets at this station, rather than accumulating data from zero. At the start of the project, representative good and bad samples were picked out of site images, the regions and classes that had to be caught were pinned down, and typical rejects were marked up on the labelling page.
With labelling done, few-shot transfer is run, and the model is then reviewed frame by frame to confirm it marks the target consistently. The first line took 10 days from arriving on site to producing verdicts, and that is where the difference in order of magnitude sits. The other benefit shows up during production: when something appears that the first batch of samples did not cover, keeping the image and adding labels is enough to keep iterating, without gathering data from scratch and retraining, and without touching the camera connections or the tensor-flow configuration.
A tilted imaging rig, so every face is seen clearly
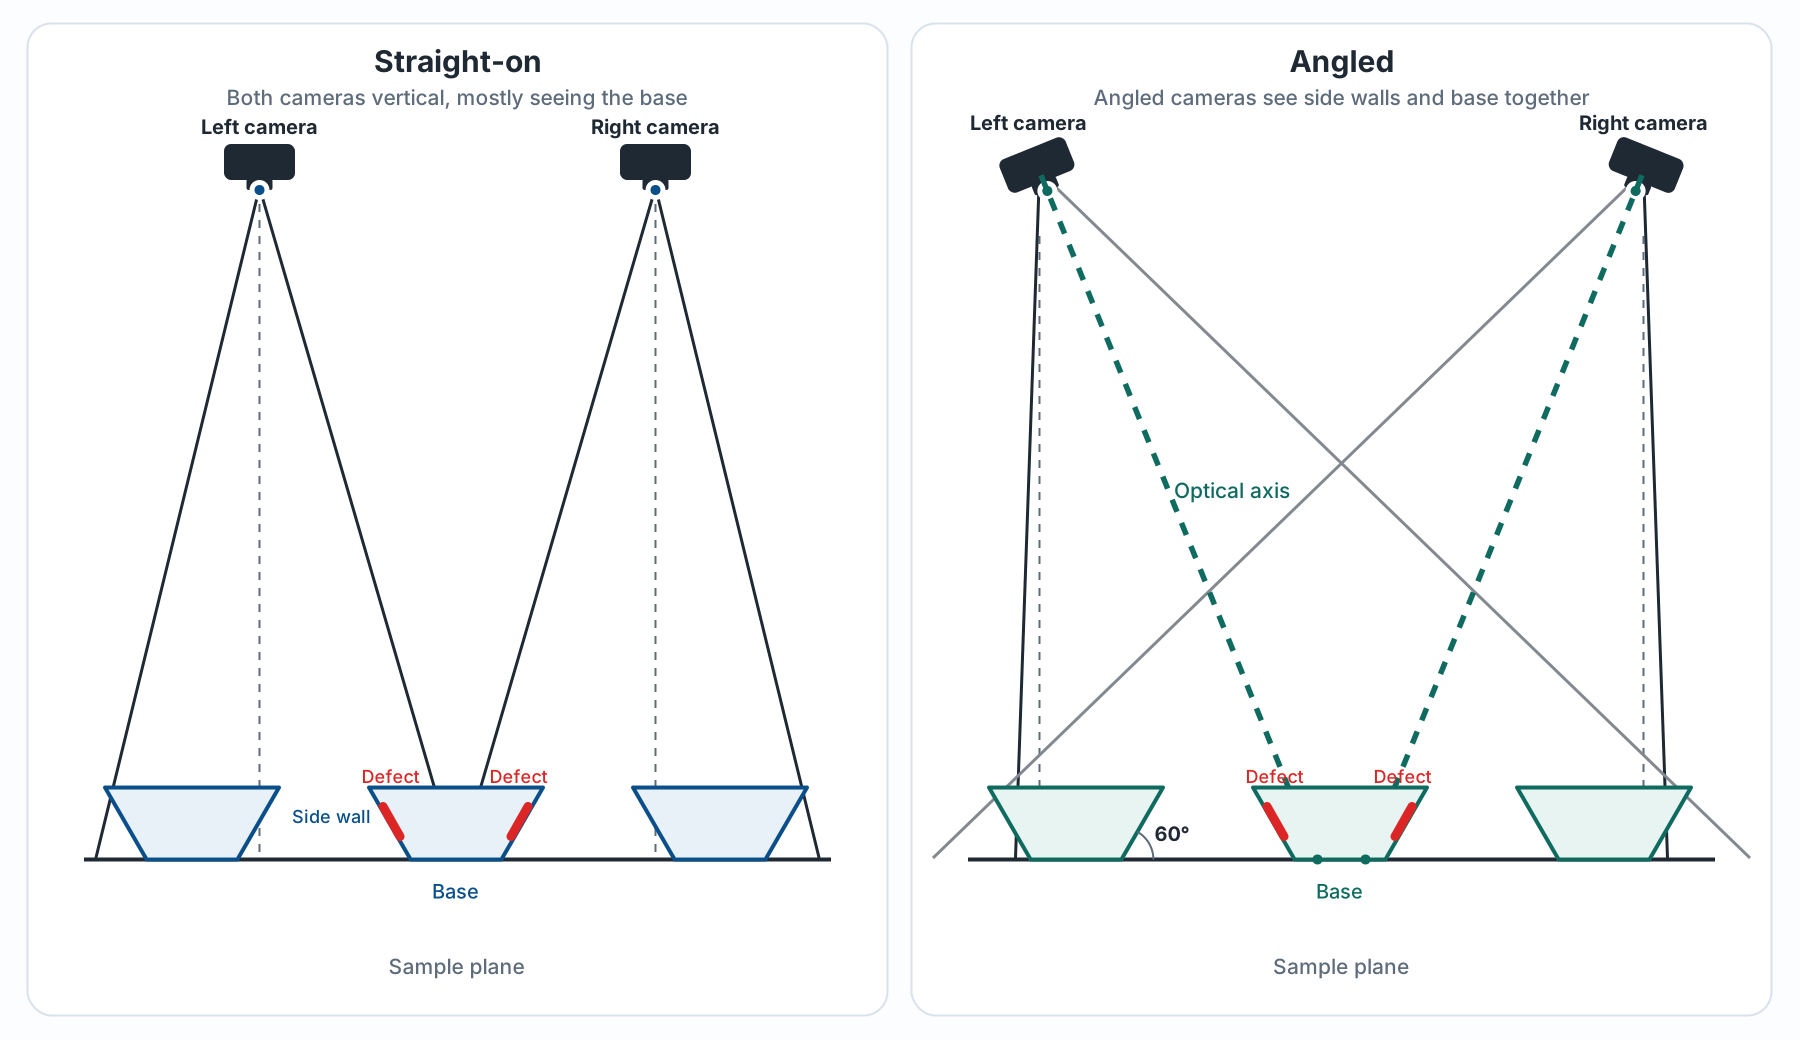
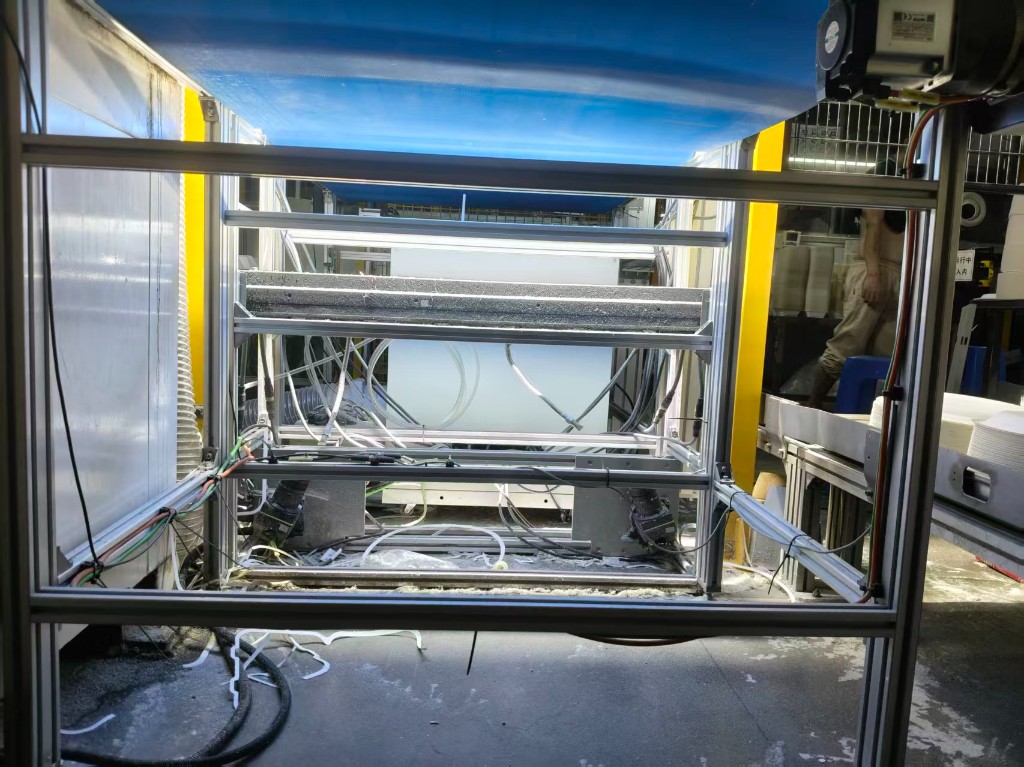
A disposable food container is not a flat printed sheet but a 3D shape with contours and side walls. With the camera fixed looking straight down, only the base is square to the sensor and the side walls are heavily compressed by perspective — a defect on a vertical face is squeezed into a thin line, or disappears altogether. That is where side-wall escapes come from.
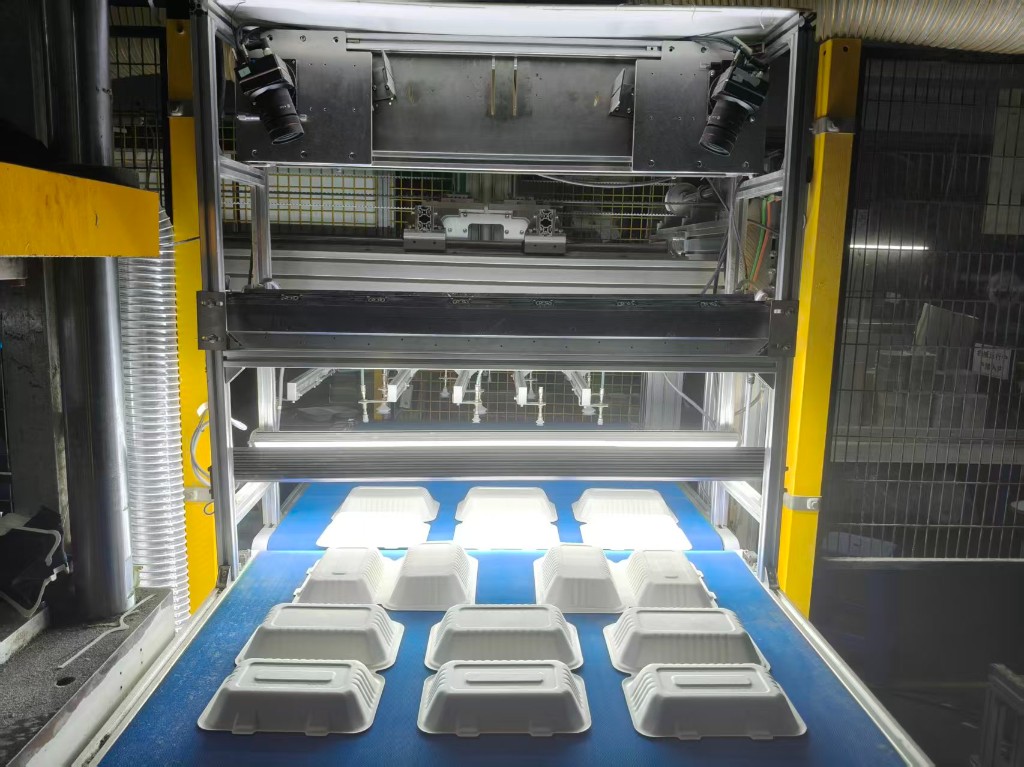
A custom tilted imaging rig is what solves exactly this: with the cameras viewing from the side, the walls and the base are in frame together, defects on the vertical faces are no longer compressed, and the whole inspection plane, about a metre wide, stays sharp. The left-and-right angled arrangement is not fussy about draft angle either: 60°, 65° and 70° variants are all handled — a changeover only adjusts the camera mounting angle, and the mechanics stay as they are.
Mechanics, optics and software: what each is responsible for
Hardware side (structure / controls, set once)
- The tilted imaging rig
- Twin-belt centre seam and conveyor sync
- Suction array physically matched to the mould cavities
- Light curtain / emergency stop / valve-bank pneumatics
- PLC motion and safety interlocks
Software side (configurable day to day / loaded at changeover)
- Product workflows and few-shot defect classes
- Camera exposure, gain, line rate and light intensity
- ROI / region boxes, area and confidence thresholds
- Mould region → suction cup / valve bank mapping
- Recipe versions, permission audit and rollback
| Configuration type | Who does it | Typical content | What it buys |
|---|---|---|---|
| Optical structure, set once | Mechanical / optical engineer | Tilted imaging layout, mounts, dark enclosure, lens and camera selection | Makes sure the side view is sharp and complete |
| Imaging recipe | VisionAgent recipes / workflows | Exposure, gain, strobe, ROI | Adapts steadily to many product types while imaging stays sharp |
| Verdict and action mapping | Software thresholds + controls interlock | Area thresholds, cavity mapping, selective release of suction cups | Lands the detection result accurately on the sorting motion |
Acceptance and the dashboard
How it actually performs on the line
Whether the model marks the target consistently only says it is usable on a single image. What the line cares about is the result after continuous running, and the customer drew two acceptance lines for that: an escape rate no higher than 1.50%, and a false-reject rate no higher than 5.00%. The escape rate applies to the batch the machine passed, meaning the share of it that manual full inspection then picked out as defective, which is what maps to outflow risk; the false-reject rate applies to the pieces the machine stopped that manual re-check confirmed as good.
First, what this set of data measures: it comes from station 709, running the 60-degree, 50-height specification — the owner agrees this is the hardest specification in the plant to inspect, so acceptance was staked on it, and once the hardest one clears the line the rest can only be easier. The equipment itself is general purpose: a change of specification changes the recipe and the model, not the hardware, so the same machine covers every specification in the plant.
The station has logged every shift since 1 August, with each shift's machine verdicts checked piece by piece against manual full inspection. Over 18 shifts and 74,916 pieces in August, the measured escape rate was 0.39% and the false-reject rate 3.28%, both inside the acceptance lines overall. The table below is the shift-by-shift acceptance record.
| Shift | Total | Machine pass rate | Manual pass rate | Machine passed (class A · manual full inspection) | Machine stopped (class B · manual re-check) | ||||
|---|---|---|---|---|---|---|---|---|---|
| Qty | Defective among them | Escape rate (≤1.50%) | Qty | Good among them | False-reject rate (≤5.00%) | ||||
| 1 Aug · day | 5000 | 78.90% | 82.04% | 3944 | 16 | 0.41% | 1056 | 174 | 3.48% |
| 1 Aug · night | 2504 | 81.60% | 83.07% | 2043 | 13 | 0.64% | 461 | 50 | 2.00% |
| 2 Aug · day | 5000 | 86.70% | 90.24% | 4333 | 9 | 0.21% | 667 | 188 | 3.76% |
| 2 Aug · night | 2000 | 86.10% | 88.15% | 1721 | 11 | 0.64% | 279 | 53 | 2.65% |
| 2 Aug · night, 2nd run | 3000 | 88.10% | 90.10% | 2642 | 22 | 0.83% | 358 | 83 | 2.77% |
| 3 Aug · night | 2000 | 90.30% | 91.35% | 1805 | 18 | 1.00% | 195 | 40 | 2.00% |
| 4 Aug · night, 2nd run | 3016 | 89.00% | 90.82% | 2684 | 20 | 0.75% | 332 | 75 | 2.49% |
| 4 Aug · day | 3700 | 89.70% | 90.78% | 3319 | 14 | 0.42% | 381 | 54 | 1.46% |
| 5 – 7 Aug · down for training | |||||||||
| 8 Aug · day | 5008 | 86.00% | 90.93% | 4309 | 4 | 0.09% | 699 | 249 | 4.97% |
| 9 Aug · day | 5136 | 82.60% | 85.86% | 4241 | 1 | 0.02% | 895 | 170 | 3.31% |
| 9 Aug · night | 5048 | 85.80% | 88.17% | 4331 | 35 | 0.81% | 717 | 155 | 3.07% |
| 10 Aug · day | 5000 | 88.30% | 90.98% | 4413 | 14 | 0.32% | 587 | 150 | 3.00% |
| 11 Aug · day | 5088 | 86.50% | 90.41% | 4401 | 7 | 0.16% | 687 | 206 | 4.05% |
| 11 Aug · night | 5016 | 88.70% | 91.81% | 4447 | 7 | 0.16% | 569 | 165 | 3.29% |
| 12 Aug · night | 5008 | 86.80% | 89.80% | 4347 | 13 | 0.30% | 661 | 163 | 3.25% |
| 13 Aug · day | 5080 | 85.40% | 88.35% | 4338 | 11 | 0.25% | 742 | 161 | 3.17% |
| 13 Aug · night | 3312 | 85.20% | 87.83% | 2823 | 12 | 0.43% | 489 | 98 | 2.96% |
| 14 Aug · night | 5000 | 89.40% | 93.44% | 4472 | 24 | 0.54% | 528 | 224 | 4.48% |
| Total · 18 shifts | 74916 | 86.25% | 89.19% | 64613 | 251 | 0.39% | 10303 | 2458 | 3.28% |
These figures follow the customer's own definitions. On the definitions of GB/T 46886-2025 General technical requirements for intelligent inspection equipment, the aggregate false acceptance rate is 0.33%, the aggregate false rejection rate 3.28% and the aggregate accuracy 96.38%.
What the operator sees on the dashboard
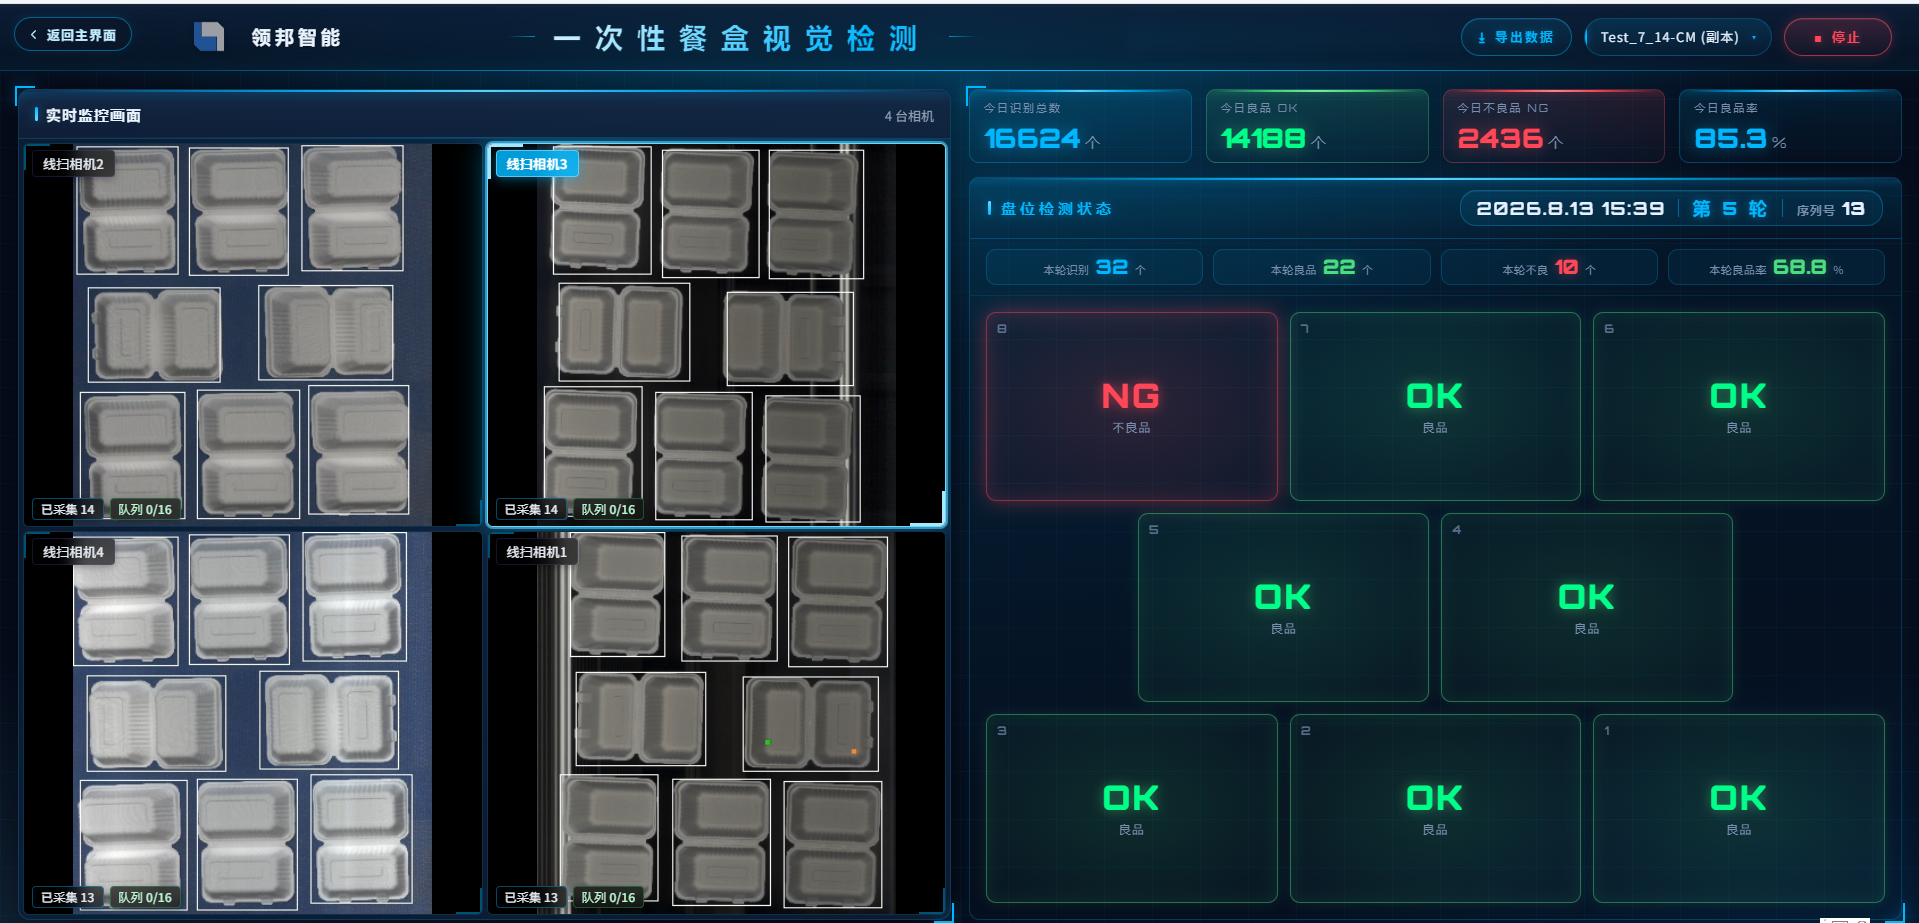
The run dashboard puts what the floor uses most on a single page: the views at left are for confirming what the system saw; each card at right is one container, green for OK and red for NG, for finding this round's rejects quickly; the top strip carries the day's totals and the equipment's running status.
At the moment of the screenshot the day stood at 16,624 pieces, 14,188 OK and 2,436 NG, a pass rate of 85.30%. Those numbers are only the record at that time; they are not a fixed yield for other days or other products.
With several lines running, an operator does not have to watch every raw view; the shared result cards and totals are enough, and when something needs checking they go back to that station's view and its detected regions.
The cost sum
Down 70%: how the sum works
First the basis: cameras, lenses, lighting, frames and the sorting actuators are needed in the same quantity either way and are left out of the comparison; the difference is concentrated in the inference compute and software layer. The figures below are rounded estimates from the project quotation.
Traditional, one set per line · 16 lines
- 16 vision systems at about US$4,200 each, US$67,000 in all
- 16 maintenance objects, each with its own system, spares and upgrades
- About US$67,000 to purchase
One-to-many · the same 16 lines
- 1 edge vision agent including the platform licence, about US$21,000
- A new station is one more configuration, with no extra hardware or licence
- 1 maintenance object: upgrades, backups and troubleshooting all in one place
- About US$21,000 to purchase
US$67,000 against US$21,000, spread across 16 lines, takes per-line inspection cost from about US$4,200 down to about US$1,300, a reduction of roughly seventy percent — that is where the 70% on the opening screen comes from. And that is only the purchase basis: in upkeep, 16 vision systems mean 16 operating systems, 16 rounds of upgrades and 16 disks that could fail, against one of each on the other side. The compute sum already showed that carrying all 16 lines still leaves 28.00% in reserve — the money saved did not come at the cost of throughput.
The first line took 10 days from arriving on site to producing verdicts, but going live is not just completing one model transfer. On site you still have to settle, item by item, what range the camera covers, which appearances have to be called defective, how a detection result maps to a specific product, and how the final call reaches the robot. The model finds the target in the image; the full chain turns that target into a result the line can act on.
“One-to-many” is not finished the moment every camera is plugged in either: each station runs its own confirmed configuration, but the correspondence between camera, model, event, product position and output has to be unambiguous — every result traceable to a specific station and a specific piece. Only then does centralised capture run steadily and leave something to troubleshoot with.
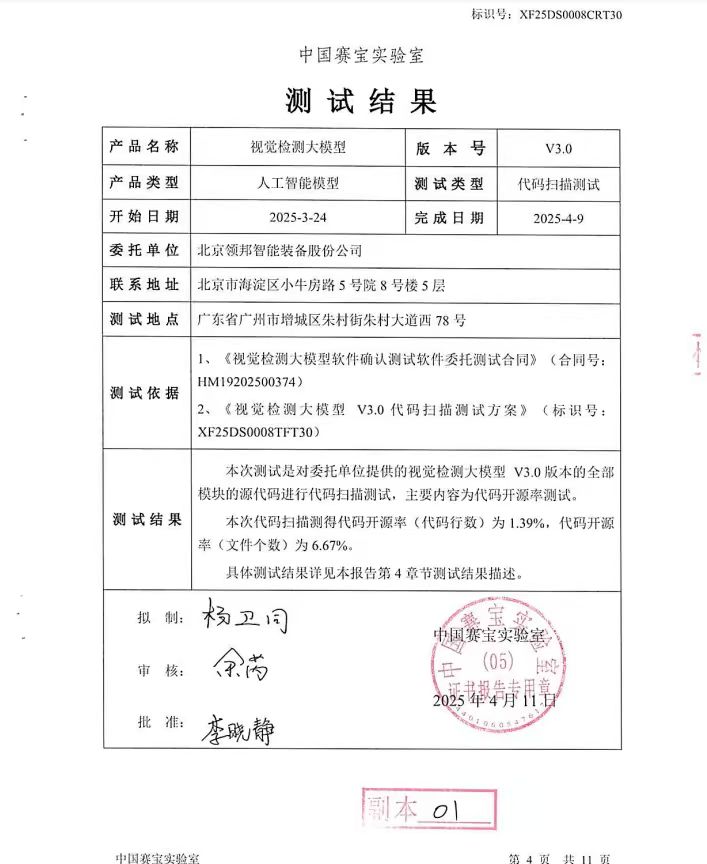
The compute sum, the cost sum and the shift-by-shift record are all set out above — what this project proved comes down to three lines.
A vision foundation model: few samples, strong generalisation;
a vision agent: general purpose, easy to use, quick to deliver;
deployed at the edge, one-to-many, make that a great many, and value for money follows.